What is Data Visualization?
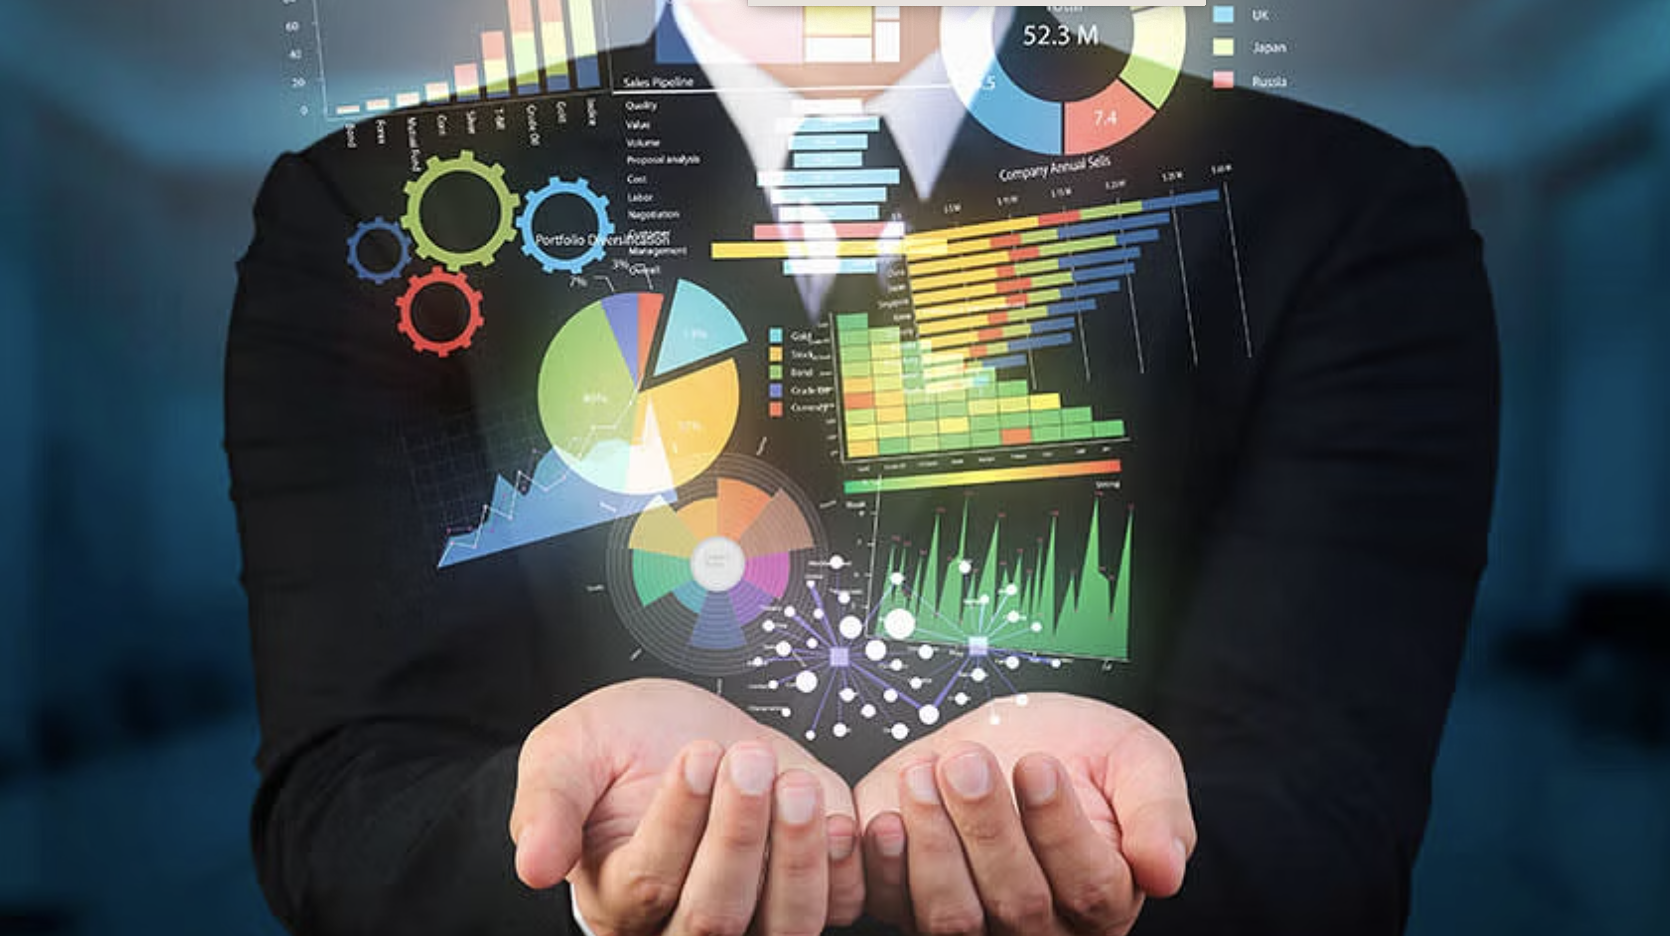
Data visualization is the process of transforming data into visual graphics, charts, and graphs that are easy to understand and interpret. It is an essential tool for businesses and organizations that need to communicate complex data to a wide audience, including executives, stakeholders, and customers.
Our Data Visualization Services
Conexie offers a range of data visualization services to meet the needs of our clients. These include:
Benefits of Data Visualization
By using our data visualization services, businesses and organizations can benefit in a number of ways, including:
Clear Communication:
Data visualization allows businesses and organizations to communicate complex data in a clear and concise way. This is essential for making informed decisions based on accurate and reliable information.
Improved Decision-Making:
By presenting data in a visually engaging way, businesses and organizations can identify trends, patterns, and insights that may not be immediately apparent from raw data. This allows them to make better-informed decisions based on accurate and reliable information.
Increased Engagement:
Data visualization is an engaging way to present data, capturing the attention of audiences and encouraging them to explore the data in more detail.
Competitive Advantage:
By using data visualization to communicate insights and trends in their data, businesses and organizations can gain a competitive advantage in their industry, allowing them to make more informed decisions and stay ahead of the competition.
What Our Customers Say
“We have worked with Conexie for a few years now, the team are always available and ready to help us improve the way we do business with our data.”
“With the Australian solar industry being one of the most saturated markets, it’s become confusing for clients to understand the benefits a better relationship with energy can provide.”
General Manager, Thomas Electrical & Solar
“We trust Conexie with the entire workflow of data from hardware install, through to acquisition, aggregation, processing, billing and analytics.”
Himari Energy
Read More on Our Blog
Contact Us Today
If you're interested in learning more about our data visualization services, please don't hesitate to contact us today. We'd be happy to discuss your specific needs and provide you with a customized solution that meets your requirements.


